Community
Participation
Working together
for change
Tough problems, like unfair access to STEM education and careers, can’t be solved unless people and groups act together. Progress also depends on bringing together many points of view.
We include and collaborate with people who are or used to be in prison to lead this work. They bring their expert knowledge, experience, creativity, and humanity to solving the system problems that prolong inequity.
We have set up three main types of groups to help with active community involvement. These groups enable STEM-OPS to achieve its vision.
All persons impacted by the carceral system are able, and encouraged, to pursue a culturally responsive and equitable high-quality STEM education and career.
Our affinity groups are made up of STEM-OPS founding members and partners. Over 60
organizations came together and formed eight groups. These groups discussed and
identified the main roadblocks to achieving the STEM-OPS vision; they also shaped our
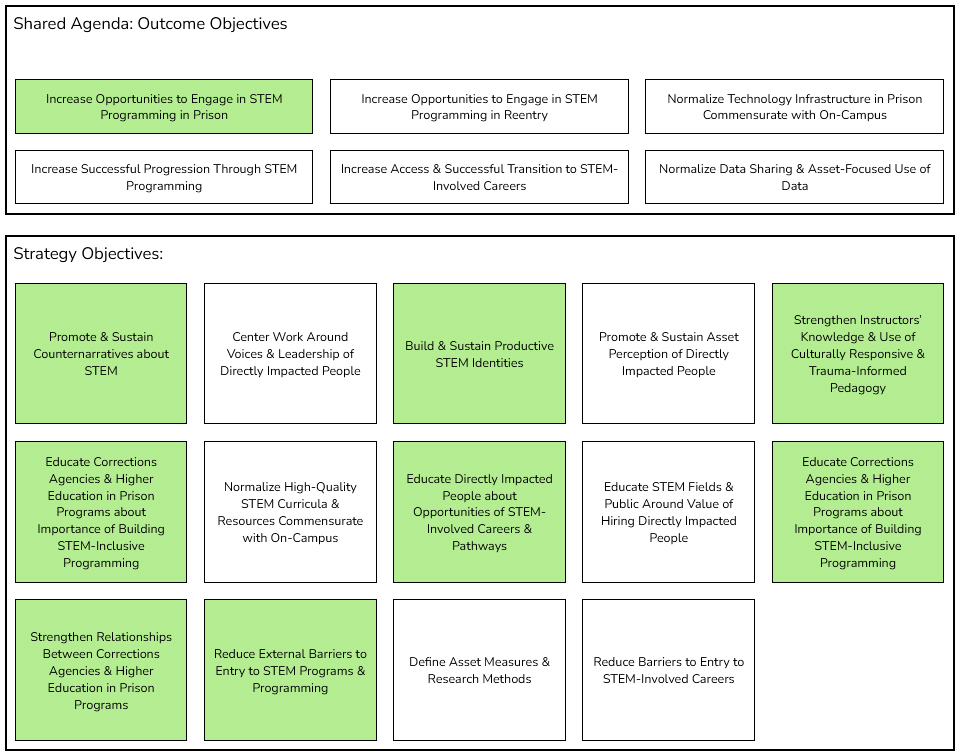
shared action plan seen in the strategy map (shown below; click the image to enlarge). Many of them also joined in as part of the
system map groups and the working groups.
The Affinity Group
• Northeast
• Southeast
• Midwest
• West Coast
• Data and Measures
• Disrupting the School to Prison Pipeline
• Formerly Incarcerated Women
• Re-Entry and Mentoring
STEM-OPS Strategy Map
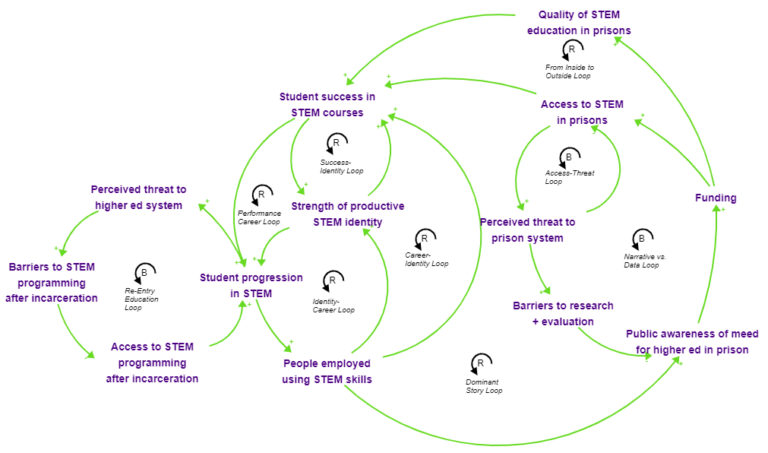
Two groups of 25 people each took part in the system mapping work. We used a process called “community-based system dynamics,” or CBSD for short. CBSD is a shared way for communities to take part in building understanding of and changing their systems. In CBSD, the people who are most involved in the system are the best ones to change it, and they can do that once they all understand the problems.
We will repeat the CBSD process every 2–3 years to identify changes in the system.
Mapping the System
How to use this Diagram
Click image for the Causal Loop Diagram Viewer
The STEM-OPS working groups work together around one or more challenges and strategies the arose from the community. The purpose of each group is to create tangible resources that can be used in diverse contexts to support those working for STEM education and careers for directly impacted people, in addition to other opportunities.
These working groups are “co-owned.” There is a facilitator and lead who will keep the work moving, but the collaborating group sets the goals, the work plan, etc., within the topic area. We welcome all who are interested in collaboratively sharing ideas and experiences to build community resources for the benefit of all, or who would simply like to be active in the group.
Click here to learn about our current working groups. Every working group will have private working space on our communication platform, Glue Up.
If interested in joining these or other upcoming working groups, email: info@stem-ops.org.
STEM-OPS Strategy Map
Click on any Outcome Objectives to see the related strategies.
Shared Agenda: Outcome Objectives
Reduce Barriers to Entry to STEM-Involved Careers